Overview
Source: Laboratory of Dr. Henrik Sundén – Chalmers University of Technology
Nuclear magnetic resonance (NMR) spectroscopy is a vital analysis technique for organic chemists. With the help of NMR, the work in the organic lab has been facilitated tremendously. Not only can it provide information about the structure of a molecule but also determine the content and purity of a sample. Compared with other commonly encountered techniques for organic chemists — such as thermal analysis and mass spectrometry (MS) — NMR is a non-destructive method that is valuable when recovery of the sample is important.
One of the most frequently used NMR techniques for an organic chemist is proton (1H) NMR. The protons present in a molecule will behave differently depending on its surrounding chemical environment, making it possible to elucidate its structure. Moreover, it is possible to monitor the completion of a reaction by comparing NMR spectra of the starting material to that of the final product.
This video exemplifies how NMR spectroscopy can be used in the everyday work of an organic chemist. The following will be shown: i) preparation of an NMR sample. ii) Using 1H NMR to monitor a reaction. iii) Identifying the product obtained from a reaction with 1H NMR. The reaction that will be shown is the synthesis of an E-chalcone (3) from an aldehyde (1) and a ketone (2) (Scheme 1).1
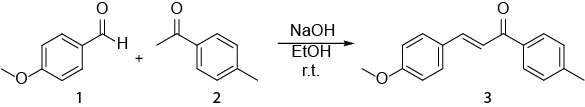
Scheme 1. Synthesis of (2E)-3-(4-methoxyphenyl)-1-(4-methylphenyl)-2-propen-1-one.
Principles
Nuclei with an odd mass or atomic number will have a property called spin, making it possible to use NMR to detect elements such as hydrogen (1H), carbon (13C), and phosphorus (31P). The spins are random and spins in random directions; however, by applying an external magnetic field these nuclei will align themselves either with or against the applied magnetic field. These two states have different energy levels: a low-energy state and a high-energy state. Irradiation with electromagnetic radiation will cause the low energy state to flip over to the high-energy state. When the radiation is ceased, the nuclei will undergo relaxation and a free inductive decay (FID) is obtained. The FID is Fourier transformed to give the peaks of the NMR spectrum. Different elements will have different frequencies leading to different chemical shifts (Table 1). The NMR spectra can provide different types of information about a compound; the integral of a peak provides the number of protons represented by it, the coupling constant (J-coupling) gives the correlation of the protons, and the splitting pattern of a peak tells how many other NMR-active nuclei are nearby (often referred to as 'neighbors').
Since 1H NMR measures 1H nuclei it is important to use deuterated solvents; otherwise the signal of interest will be lost in the noise of the solvent signal.
| Type of proton | Shift (δ, ppm) | Type of carbon | Shift (δ, ppm) |
| 1° Alkyl, RCH3 | 0.8–1.2 | 1° Alkyl, RCH3 | 0–40 |
| 2° Alkyl, R2CH2R | 1.2–1.5 | 2° Alkyl, R2CH2R | 10–50 |
| 3° Alkyl, RCHR2 | 1.4–1.8 | 3° Alkyl, RCHR2 | 15–50 |
| Allylic, R2C=CRCH3 | 1.6–1.9 | Alkene, C=C | 100–170 |
| Ketone, RC(=O)CH3 | 2.1–2.6 | Aryl, C in aromatic ring | 100–170 |
| Ether, ROCH2R | 3.3–3.9 | Alcohol or ether, R3COR | 50–90 |
| Alcohol, HOCH2R | 3.3–4.0 | Carboxylic acid or ester, RC(=O)OR |
160–185 |
| Vinylic, R2C=CH2 | 4.6–5.0 | Aldehyde or ketone, RC(=O)R |
182–215 |
| Vinylic, R2C=CRH | 5.2–5.7 | ||
| Aromatic, ArH | 6.0–8.5 | ||
| Aldehyde RC(=O)H | 9.5–10.5 | ||
| Alcohol hydroxyl, ROH | 0.5–6.0 | ||
| Carboxylic, RC(=O)OH | 10–13 |
Table 1. Common proton and carbon NMR chemical shifts.2
Procedure
1. Preparation of NMR Starting Material
- Add ~10 mg starting material to a clean NMR tube.
- Dissolve the starting material in ~0.7 mL deuterated solvent (example given CDCl3). A suitable height of the solvent for a good spectrum is 4.5-5 cm.
- Cap the NMR tube carefully and write the sample name on the cap.
- Shake the sample gently to ensure that all material had dissolved. Take care to avoid contact between the solvent and the cap, which could lead to possible contamination of the sample.
- Insert the NMR tube carefully into a spinner. The spinner will rotate once inserted into the magnet to ensure that the entire sample experiences a homogenous magnetic field. Clean the outside of the NMR tube and spinner with 2-propanol and lab tissues in order to remove fingerprints and dirt.
- Place the spinner in a sample depth gauge to ensure that the bottom of the NMR tube is not inserted too far into the NMR probe as that could possibly damage the spectrometer. Different probes have different sample depths and the user should be aware of the specific depth gauge.
- Place the sample in the NMR spectrometer. Here a Varian 400 MHz spectrometer, equipped with an autosampler, was used.
- After completion of the NMR measurement, process the spectrum and assign the peaks in the spectrum.
2. Preparation of 3 M NaOH and Chalcone Synthesis
- Add 60 mg NaOH to a 50-mL volumetric flask.
- Dissolve the NaOH by adding deionized water to half of the flask. Dilute the solution further by adding more water until the mark is reached.
- Add 10 mL ethanol to a 50-mL round-bottom flask equipped with a magnetic stir bar.
- Thereafter, add 680.5 mg 4-methoxybenzaldehyde and 5 mL NaOH solution prepared in step 2.1 to the same flask.
- Add 671 mg 4-methylacetophenone subsequently to the stirred solution and cap the flask and stir at room temperature.
- Monitor the progress of the reaction by 1H NMR at 30 min intervals (see step 3) until full consumption of starting materials.
- Add 5 mL water when the reaction has reached completion (~3 h). Filter the resulting precipitate and wash it with 20 mL 1:2 ethanol/water. Let the precipitate air dry.
- Calculate the yield of the obtained product. Prepare an NMR sample according to step 1.2.2.7. Check purity with 1H NMR. If not pure, purify the product via recrystallization with ethanol.
- Add approximately 3 drops of reaction mixture to an NMR tube using a Pasteur pipette and rinse the pipette with deuterated solvent.
- Repeat steps 1.2–1.8.
3. Brief Interpretation of an NMR Spectrum
- Process the spectrum with a suitable program (example given MestReNova).
- Correlate the different peaks to the NMR shifts in Table 1. The chemical shifts gives a hint of what type of environment the protons exists in.
- Integrate the peaks to give the number of hydrogens corresponding to each peak. Integration of all peaks gives a relative number of total protons.
- Evaluate the splitting of the proton-peaks, which indicate the number of neighbors.
- Measure the J-coupling to see how the protons are connected to each other.
Results
By comparing the spectra of the starting materials (Figures 1 and 2) to that of the final product (Figure 5) a clear difference between the spectra can be observed, indicating formation of the chalcone. The endpoint of the reaction can be determines by taking NMR samples at different time-intervals; for example, the aldehyde proton peak (C(=O)H) (1) can be seen in Figure 3 but not in Figure 4, signifying completion of the reaction after 3 h. By looking at the integrals, splitting patterns, and J-couplings of the peaks, it is possible to validate the structure of the chalcone. The integrals of the peaks (numbers under the peak, Figure 5) show the relative amount of hydrogens present which should correlate to the amount of hydrogens found in the product. Furthermore, the splitting pattern gives an indication of the number of neighbors; for example, peak (5) and (1) — both singlets — indicate no neighbors nearby with integrals of 3 correlates with the MeO- and the Me-group respectively. By comparing the chemical shifts in the spectra with Table 1 it is possible to elucidate that the MeO-group corresponds to the singlet at 3.80 ppm and the Me-group to 2.45 ppm. Moreover, formation of the double bond can be seen as two doublets (Figure 5), 7.80 and 7.44 ppm. Looking at the J-coupling of 16 Hz indicates formation of an E-alkene; the Z-alkene typically has a smaller value of 10–12 Hz.3 Assigning the aromatic peaks verifies the structure (Figure 5).4

Figure 1. Assigned 1H NMR spectra of 4-methylacetophenone Please click here to view a larger version of this figure.

Figure 2. Assigned 1H NMR spectra of 4-methoxybenzaldehyde. Please click here to view a larger version of this figure.

Figure 3. Crude 1H NMR spectra after 30 min showing the residual aldehyde peak. Please click here to view a larger version of this figure.

Figure 4. Crude 1H NMR spectra after 3 h showing no aldehyde residual peak. Please click here to view a larger version of this figure.

Figure 5. 1H NMR spectra of the obtained product after work-up. The inserted picture shows the J-couplings of the alkene. Please click here to view a larger version of this figure.
Applications and Summary
NMR can, for example, be used to detect reaction intermediates, facilitating the work in elucidation of a reaction mechanism. With the help of NMR it is also possible to observe molecular motions and interactions important for drug development. Furthermore, NMR can give structural information about solid materials; for instance to provide a rationale for observed material properties. Other applications of NMR can be found in the field of medicine, where magnetic resonance imaging (MRI) is frequently used for medical diagnosis. NMR has also been used in metabolomics to detect different metabolites excreted by an organism thus providing a metabolic fingerprint. The uses of NMR are wide; from determining the structure of a single molecule to imaging of the human brain.